Saturday 13 April 2024

The skew of tax payers

 The IFS as ever has amazing statistics.


1. the tax landscape (https://ifs.org.uk/taxlab/taxlab-key-questions/where-does-government-get-its-money?tab=tab-312) 

Two-thirds of tax revenue comes from just three taxes: income tax, (28%) National Insurance contributions (NICs) (18%) and value added tax (VAT) (18%).  Company tax = 11%.  excise taxes 9%. (that's 84%). 

2. Corporation tax https://ifs.org.uk/taxlab/taxlab-taxes-explained/corporation-tax-explained

"In 2018–19, 55% of all corporation tax was paid by companies that made a tax payment of £1 million or more: a group of fewer than 5,000 companies, making up just 0.3% of the population of corporation-tax-paying businesses."

3. income tax (https://ifs.org.uk/taxlab/taxlab-key-questions/where-does-government-get-its-money?tab=tab-312) 


Higher rate taxpayers are 10% of the adult population: 6.5m people


what about the skew?

"In 2023–24 the top 1% of taxpayers (that is, those with incomes exceeding £214,000) received 13% of taxpayers’ pre-tax income and provided 29% of all income tax revenue." 

" The top 10% of taxpayers paid 60% of all income tax in 2023–24, up from 35% in 1978–79. The share of income tax revenue contributed by the top 1% of taxpayers rose from 11% in 1978–79 to 29% in 2023–24, despite big cuts in top rates of tax in the first 10 years of that period. 


Monday 22 May 2023

What is chain drift?

 A nerdy blog. 

1. many goods have lots of variation in prices e.g. with sales

2. suppose, says Eriwn Diewert in Scanner Data, Elementary Price Indexes and the Chain Drift Problem

Revised October 13, 2021 we have the following data where good 2 is never on sale, but good 1 is and gets a massively changing set of quanties, rising in the time, then returning, but importantly, not instantly, to initial quantities


3. beccause the post sale adjustment, plausible if, for example, its a durable good, is slow, chained weights do not return back to initial levels. 

4. the table below shows "Table 2 lists the fixed base Fisher, Laspeyres and Paasche price indexes, PF(FB), PL(FB) and PP(FB) and as expected, they behave perfectly in period 4, returning to the period 1 level of 1. Then the chained Fisher, Törnqvist-Theil, Laspeyres and Paasche price indexes, PF(CH), PT(CH), PL(CH) and PP(CH) are listed. Obviously, the chained Laspeyres and Paasche indexes have chain drift bias that is extraordinary but what is interesting is that the chained Fisher has a 2% downward bias and the chained Törnqvist has a close to 3% downward bias."


Monday 17 April 2023

GDP and health: stocks, flows, output and outcomes

 Interesting discussion at Imperial today.  

1. The health of a nation can be thought of as an outcome (e.g. premature death) and/or a stock (the number of heavy smokers) and/or a flow (number of operations performed per year). 

2. GDP is a flow.  It is the flow of output via people purposefully employed in producing that output flow.  It isn't outcomes.  So a healthy society via social norms or parents helping their children produces an outcome but not an output.  The output of health is operations done, patients seen.  Which can of course be measured better.

3. Missing markets.  Well, people at home are producing things as well.   Not only with modern working from home, but reading to children, looking after family all of which produces a flow of services.  But, we don't typically have that included in GDP since we don't know what price to allocate to that activity, since it's not an activity that's sold in the market.  We could make some assumptions e.g. by taking the market price of a carer working for a care home but typically we don't do this. 

4.  So, GDP doesn't necessarily measure well-being.  

5. In our Indigo Prize essay we explain more on GDP as a flow, adding up the flow of iPads, pencils and 737s, and going beyond GDP.  And the ONS produces a dashboard of health outcome indicators

Saturday 4 March 2023

Policy-making under uncertainty: a case study

 A column by Megan Greene, FT, Dec 2 2021 reminds me of the omicron situation in Winter 2021.


November 30, 2021


The chief executive of Moderna has predicted that existing vaccines will be much less effective at tackling Omicron than earlier strains of coronavirus and warned it would take months before pharmaceutical companies could manufacture new variant-specific jabs at scale.

November 30th 2021

[Mr.Sahin is]...refusing to panic about the spread of Omicron, its newest variant. “I am personally not scared about the situation. We expected such a variant to come,” Ugur Sahin told The Economist in an interview. He is co-founder and chief executive of BioNTech,

December 1st 2021

Vaccines will likely protect against severe Covid-19 cases from the new omicron variant...WHO chief scientist Soumya Swaminathan said


Monday 21 February 2022

Prospects for business investment

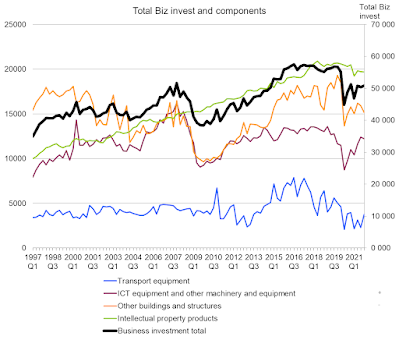
 The latest ONS business investment data, chained volume indices show 


What do we make of this? 

1. Overall investment took a beating in the financial crisis, then recovered. But it stalled again post the 2016 Brexit referendum.  It collapsed in the pandemic, and has not recovered.

2. The lack of recovery is mainly due to the fall in buildings, which has hardly recovered at all. 

3. IPP and ICT investment has stayed flattish and recovered respectively.

4.  Transport equipment, which is very volatile anyway has continued on a downward trend.  

5. Over the longer term, the constant is rising IPP investment.  ICT investment is not even back to pre-financial crisis levels. Buildings is back to 1997 levels. 

Wednesday 13 October 2021

Friday 28 May 2021

Explanations for low productivity growth: some history

As this paper nicely points out,  Shimaa Elkomy et al, "Energy and Productivity, A review of the literature" https://cusp.ac.uk/wp-content/uploads/pp-energy-report.pdf#ppem, the explanations seem to be rather the same: 


"For example, in 1966 Cambridge economist Nicholas Kaldor pointed to (and rejected) a number of common explanations for the UK’s declining productivity growth. Many of these reappear in the UK government’s recent industrial strategy (Table 2). Either we have made little progress in tackling these issues in the intervening half century, or we have missed a key element of productivity"


Kaldor, N. (1966) Causes of the Slow Rate of Economic Growth of the United Kingdom: An Inaugural Lecture. Great Britain: University of Cambridge Press

BEIS (2018) Industrial Strategy: Building a Britain Fit for the Future. Available at: 78 | CUSP WORKING PAPER No 23 https://assets.publishing.service.gov.uk/government/uploads/system/ uploads/attachment_data/file/664563/industrial-strategy-whitepaper-web-ready-version.pdf (Accessed: 29/04 2018)

Wednesday 12 May 2021

Has Globalisation Slowed Down

 Happy to have done a Tuck/Dartmouth college panel on this.  Here's some data from Pol Antras on "slowbalisation" https://scholar.harvard.edu/files/antras/files/deglobalization_sintra_antras.pdf


a.       "The world trade‐to‐GDP ratio – a standard measure of globalisation – has recovered from its late 2008 low, while last year, the share of migrants in world population attained its highest level since 1990

b.       Concerning the ratio of world trade to world GDP in the last fifty years, 1970-2020

                                                               i.      The ratio of world trade to world GDP almost doubled (increasing by a factor of 1.72) during that period of “hyperglobalisation”.

                                                             ii.      I find that 80% of the growth in this ratio occurred during the subperiod 1986‐2008. (Why? Combination of ICT, fall of communism, China, shipping costs falling)

                                                           iii.      Because many measures of globalisation are simple ratios or shares that have natural upper bounds, I argue that growth explosions in trade openness of the type experienced during the hyperglobalisation of 1986‐2008 are simply not sustainable. In other words, a period of “slowbalisation” was inevitable."


Here's his figure 1


Tuesday 2 February 2021

Pass Through

 This 2014 paper on cost pass-through is a nice summary.  


Our discussion of relevant theory is framed in terms of absolute pass-through: the degree to which a given absolute change in cost causes an absolute change in price

The extent of industry-wide cost pass-through in a perfectly competitive market depends on the elasticity of demand relative to supply. The more elastic is demand, and the less elastic is supply, the smaller the extent of pass-through, all else being equal


With other market structures, economic theory indicates that: 

– Pass-through depends on the curvature of demand. It is greater with convex inverse demand (the inverse demand curve becomes steeper as output decreases) and smaller with concave inverse-demand (the inverse demand curve becomes flatter as output decreases), all else being equal. 

– Pass-through is smaller when marginal cost curves slope upwards (i.e. marginal cost increases as output increases) and greater when marginal cost curves slope downwards (i.e. marginal cost falls as output increases). 

– Pass-through in excess of 100% is possible when inverse-demand is convex enough and/or when there are strong increasing returns to scale such that marginal cost curves slope sufficiently downwards. Industry-wide cost increases can result in increased profits when demand is very convex.

Many theoretical models indicate that pass-through of industry-wide cost changes increases with the intensity of competition1 , provided that inverse demand is not very convex,

The paper usefully illustrates some examples of industry curvature.


"Suppose that a monopolist faces an increase in its unit costs. The monopolist will consider its scope to adjust its price upwards. 

The monopolist will think: “how much output do I have to sacrifice to pass on a certain amount of this change in my costs?” If the answer is “very little”, passing on the cost shock will be more attractive; if the answer is “a lot”, passing on the cost shock will be less attractive. The answer to the monopolist’s question is related to the curvature of demand. Other things being equal, pass-through will be lower if inverse demand is concave (because passing on the cost increase will cause a relatively large fall in output). On the other hand, pass-through will be higher with convex demand (since passing on the cost increase has a smaller impact on volumes)."

A useful formula in Genakos, 2019, summarises this. 


where 

  • rho is the impact of an incrase in marginal cost on price
  • theta is price marginal cost margin times product demand elasticity, an intensity of competition index (theta=0 competition, theta=1 monopoly)
  • es the elasticity of supply 
  • ems is the curvature of demand (strictly the curvature of log demand). 
  • etheta how intensity varies with quantity


special cases
  • theta=0, 
  • MC=constant, ed-theta/es = 0; demand linear ems=1, then rho=1/1+theta and so more monoply means less pass-through.